

Most traders watch the right edge of the chart.
That is where the attention goes. What price is doing now. What it did in the last hour. What the last few candles are saying. It feels like the most important part of the chart because it is the newest part.
The newest part matters. But it mainly reports. It shows you where price is standing, not what lies ahead of it.
So the answer to what lies ahead has to come from elsewhere on the chart.
The left side of the chart gets treated as finished business. A swing runs, it ends, and the trader scrolls past it. Nothing more to take from it.
That assumption is a mistake.
A finished move does not stop working when price leaves it behind. It carries forward in time, and shows up again later. When it does, the market tends to repeat what it did before. Not every time, of course. But often enough to matter.
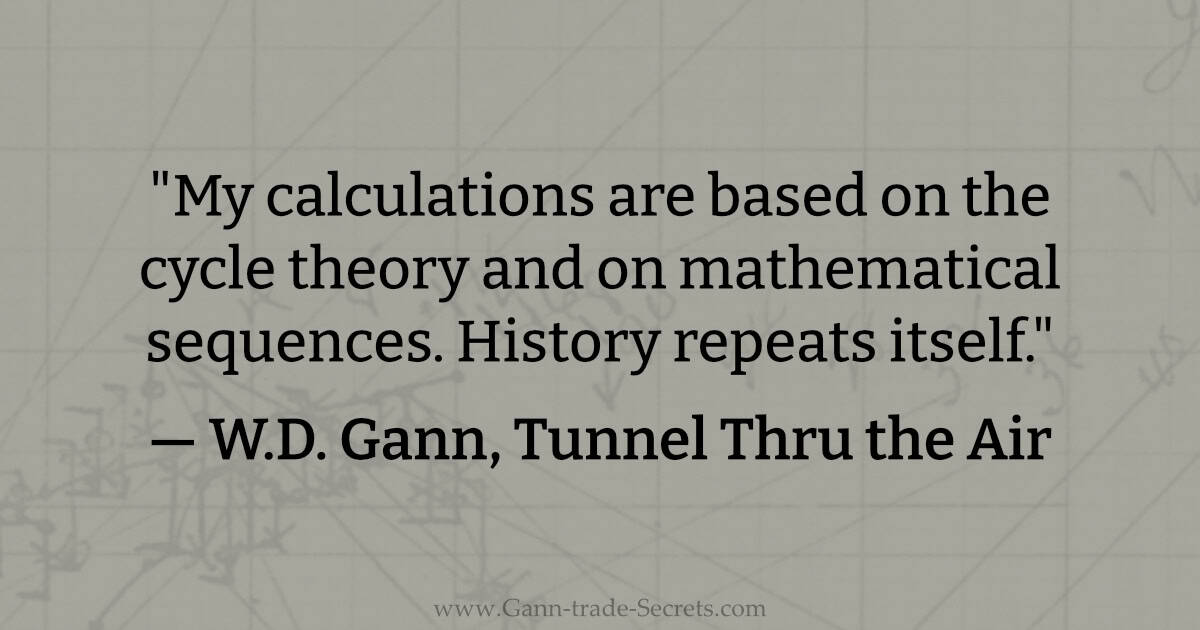
Gann said this plainly in Tunnel Thru the Air. He wrote that his calculations were based on cycle theory and mathematical sequences, and that the future is a repetition of the past. He said much the same thing in his 1909 interview.
That was not a philosophy. It was how he calculated. This is the ground the Law of Vibration sits on, and it is not what the word usually means today.
That is a very different way to read a chart. You are not asking what the price is doing now. You are asking what this market has already done and when it is due again.
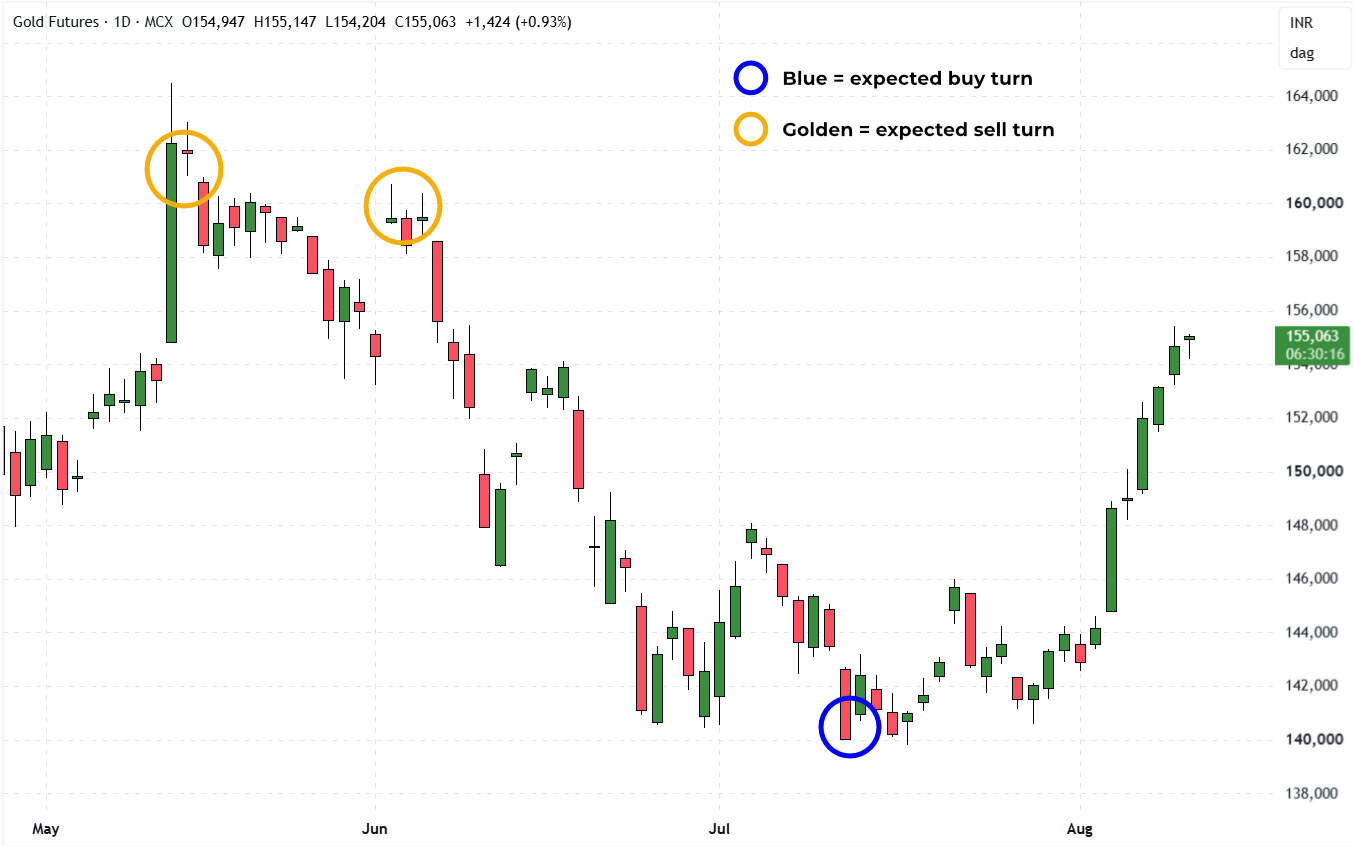
The chart below shows what that looks like on a real market. The circles mark expected turns. One chart is not proof. It shows what this way of reading a chart produces.
Everyone can scroll left. That is not the hard part. A chart holds hundreds of finished moves. Only a few of them matter.
Start with the free report. It shows why the movement you call noise is not random.


